BCG model
he Boston Consulting group’s product portfolio matrix (BCG matrix) is designed to help with long-term strategic planning, to help a busi...
https://interviewquestions68.blogspot.com/2017/11/bcg-model.html
he Boston Consulting group’s product portfolio matrix (BCG matrix) is designed to help with long-term strategic planning, to help a business consider growth opportunities by reviewing its portfolio of products to decide where to invest, to discontinue or develop products. It's also known as the Growth/Share Matrix.
The Matrix is divided into 4 quadrants derived on market growth and relative market share, as shown in the diagram below.
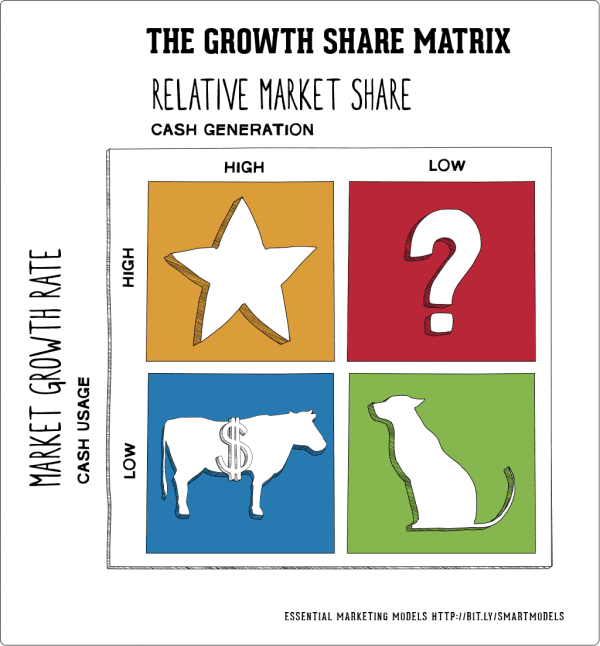
- 1. Dogs: These are products with low growth or market share.
- 2. Question marks or Problem Child: Products in high growth markets with low market share.
- 3. Stars: Products in high growth markets with high market share.
- 4. Cash cows: Products in low growth markets with high market share


